Part I: High Inflation: Where Did it Come From?
[This piece is in two parts (due to email constraints - if you subscribe you get the post by email), dealing with the sources of the high inflation we’re experiencing. I’ll deal with the monetary policy issues in another piece.]
For the impatient, here’s an executive summary of what I’ll discuss in this two-part post, and the policy post to follow: The consensus view on the Federal Open Market Committee (FOMC) is that, if inflation is above (below) target, it is brought down by increasing (decreasing) the target for the overnight nominal interest rate. If we accept that view, then the FOMC made a serious policy error. Inflation has been above the Fed’s 2% inflation target since March 2021, but the FOMC waited a full year to take action in the form of a target interest rate increase. Why did it wait? Because it was overconfident in its ability to understand how the economy works - particularly during an unprecedented pandemic - and overconfident in its ability to forecast future events. That overconfidence led the Committee to commit in 2020 to a policy framework based on a faulty evaluation of post-financial crisis macro history —serving to illustrate why policy commitment can actually be a bad thing.
What caused the high rate of inflation as we exited the throes of the pandemic? It’s hard to have confidence that any of the typical culprits is to blame, but one could make a case that the Fed is now making another error. The FOMC eventually decided that high inflation is not transitory, and that it needed to be assaulted with aggressive interest rate increases. But maybe the transitory view was not so crazy. Maybe high inflation would indeed go away on its own, but for the fact that the Fed’s actions could act to accommodate it.
The Problem
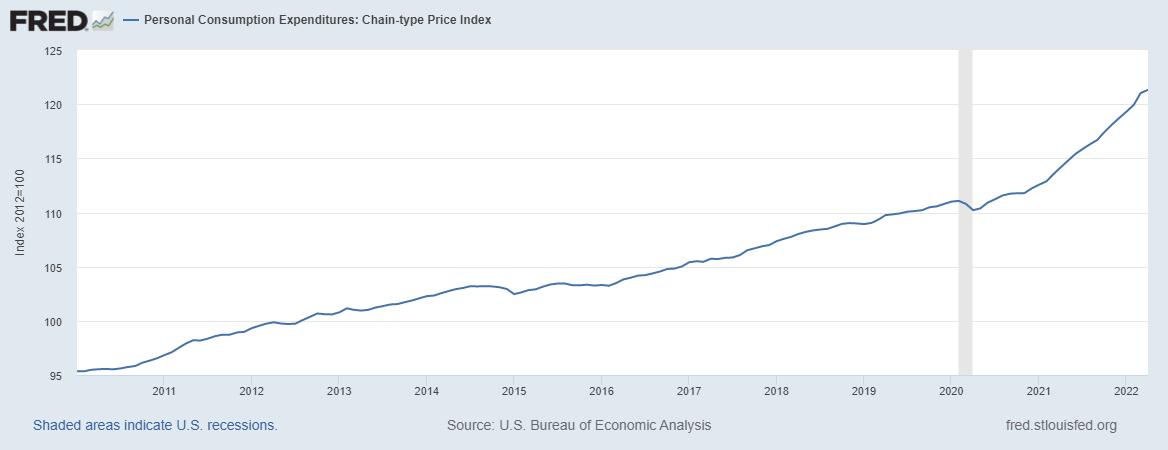
First, to remind you what’s going on, here’s a time series for the PCE deflator.
Chart 1
Note that I’m using the PCE deflator as PCE inflation is what the FOMC claims to be targeting. So, in eyeballing the time series you might notice a break in the trend in early 2021. Or, if we look at the year-over-year measure of the inflation rate, as is typical:
Chart 2
So, in March 2021, the inflation rate exceeded the 2% inflation target. But in June 2021 (to account for data lags relative to actual decisionmaking), the FOMC says in its statement:
With inflation having run persistently below this longer-run goal, the Committee will aim to achieve inflation moderately above 2 percent for some time so that inflation averages 2 percent over time and longer‑term inflation expectations remain well anchored at 2 percent. The Committee expects to maintain an accommodative stance of monetary policy until these outcomes are achieved.
And in the dot plots published after the June 2021 FOMC meeting, the median committee member was predicting an overnight rate target of 0.125% at the end of 2022, with the overnight rate still below 1% by the end of 2023. By October 2021, in Chart 2 the inflation rate had exceeded 5% and was still increasing. What did the FOMC tell us in December 2021?
With inflation having exceeded 2 percent for some time, the Committee expects it will be appropriate to maintain this target range until labor market conditions have reached levels consistent with the Committee's assessments of maximum employment.
Recall that an issue with the Fed’s new policy framework, adopted in 2020, is that it appears to define “maximum employment” as unattainable - thus shortfalls in employment from the “maximum” could always be used to justify an accommodative policy. But what was actually going on in the labor market at the time?
Chart 3
In October 2021, the job openings rate had reached a historical high of 6.8%, and the unemployment rate in November 2021 was 4.2% — not as low as in February 2020, but given the high vacancies, by some metrics the labor market was tighter at the end of 2021, than before the pandemic. Not “maximum employment,” though, according to the FOMC. So the policy rate didn’t move, in spite of the fact that inflation had been above target since March 2021, and well above target by December 2021. However, committee members were anticipating an earlier tightening than before. For example, in the December 2021 dot plots, the median committee member was thinking that the overnight rate would be at 0.75% by the end of 2022.
By March, however, panic had set in, and the FOMC proceeded to increase the overnight rate target in three moves (March, May, June 2022) by 150 basis points, which is unprecedented in size in the upward direction. As well, Fed asset purchases were stopped as of March 2022, and assets are now being permitted to run off the Fed’s balance sheet.
What Caused the High Inflation?
Did the Phillips Curve Do It?
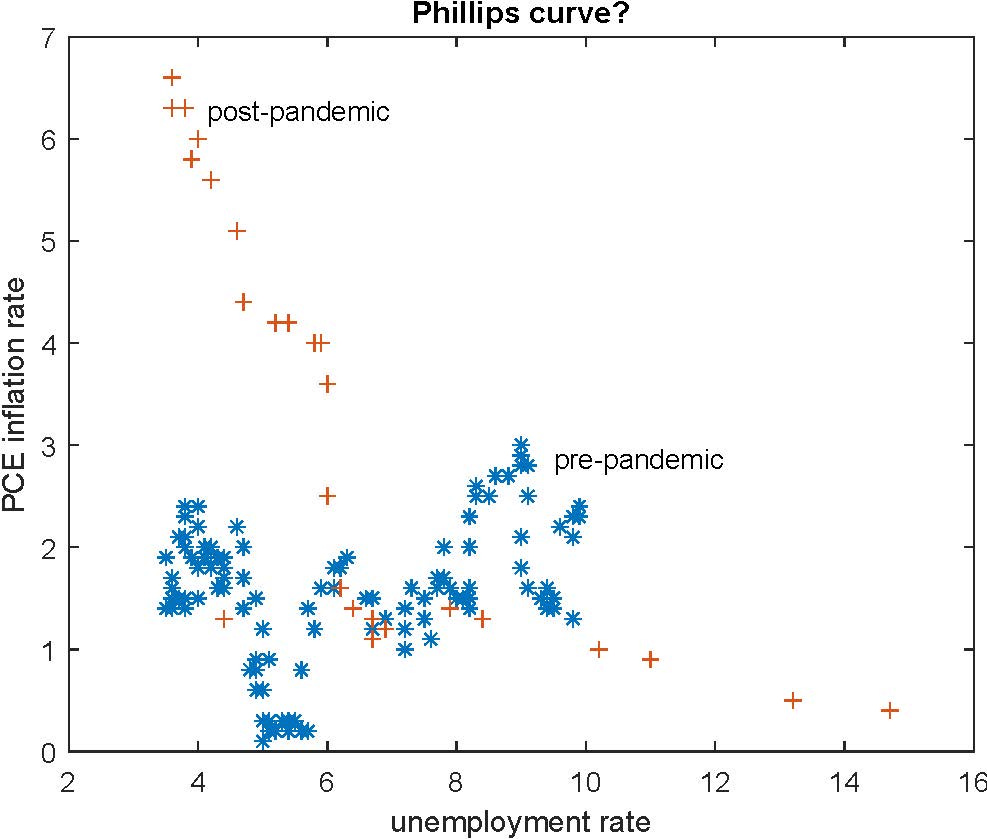
A standard narrative before the pandemic was that the Phillips curve (PC) had become “flat.” You can find plenty of Fed insiders who talked about this, including Lael Brainard. Hardcore adherents of the PC theory of inflation seem to think that central banks control inflation by controlling the unemployment rate, so long as inflation expectations are “anchored.” So, if you’re one of those people, and you think the Phillips curve is flat, you think that the only avenue for controlling inflation is to influence inflation expectations, thus shifting the “inflation-augmented PC,” as it was called in the old days. Here’s a scatter plot of PCE inflation vs. the unemployment rate, both pre-pandemic (January 2010 to February 2020) and pandemic (post-February 2020).
Chart 4
You can see a “flat” PC (though more like a Phillips curve with the wrong sign) in the pre-pandemic data. Then, after the onset of the pandemic, the PC woke up, and we observe a traditional negatively sloped relationship between the inflation rate and the unemployment rate. I think this makes PC adherents happy.
But, if you’re a PC person, and you take the pandemic observations in Chart 4 as tracing out the now-wide-awake PC, what would you conclude about how we should control inflation? We can make a case that inflation expectations are still “anchored,” in that it’s hard to trust survey measures of inflation as measuring anything that people are actually acting on, and bond market measures of anticipated inflation don’t show anything alarming. For example, the breakeven inflation rate we back out from 10-year nominal Treasury yields and 10-year TIPS is at 2.6%. So, adjusting for the fact that TIPS are indexed to the CPI, not the PCE, and that people may be willing to pay a lot for inflation insurance now, maybe anticipated inflation isn’t far off 2%. So, if you buy into PC theory, it takes a recession to bring inflation down - perhaps an unemployment rate of about 6%, from Chart 4. But before the pandemic, Fed people didn’t seem to think that an unemployment rate as low as 3.5% was consistent with “maximum employment,” so with expectations anchored at 2%, why did the natural rate of unemployment rise to about 6%? A hardcore PC person might argue that we’re currently “overheating.” As the argument goes (and you can find thinking like this in Ben Bernanke’s new book), supply constraints shift the Phillips curve too, so presumably the natural rate is now higher. But the supply constraints are going away, so why won’t inflation just go down on its own?
I don’t find Phillips curve reasoning helpful. First, it relies too much on unobservables — in particular the “natural rate of unemployment” and some measure of “slack,” as well as inflation expectations. That’s especially problematic in a policy setting — people can cook their measures of whatever to manipulate policy decisions for other reasons than pure economics. Second, the PC is notoriously unstable. I don’t know of PC types who, in 2020, were forecasting a Phillips curve awakening. The FOMC, which seems to consist primarily of PC types, predicated its new policy framework on a flat Phillips curve. They were thinking hard about the Phillips curve, but that led them to make a policy error, in terms of how they do inflation control. If you can’t tell me why the PC is flat, or tell me when the PC will wake up, or when it will go to sleep, what good is the PC in formulating policy?
It’s All About Demand and Supply?
Econ 101 demand/supply reasoning sometimes works well — just read the boxes in your average Principles of Micro book. However, in helping us understand and deal with inflation, this type of approach leaves something to be desired.
First, demand/supply reasoning sometimes manifests itself in what I’ve seen called the “micro approach to inflation.” This involves going market by market, and pointing out why prices, in dollar terms, are up in each market either due to a shift in the supply curve, a shift in the demand curve, or both. Supply of cars is down because car manufacturers can’t get chips, demand for cars is up because the government gave everyone a pile of cash, for example.
What’s the problem here? Inflation is a macro phenomenon, of course. In a partial equilibrium demand/supply diagram, supply and demand depend on relative prices, but inflation involves the rate of change over time in the price of goods and services in terms of the unit of account/medium of exchange. To think about that, we need general equilibrium, we need dynamics, we need forward-looking behavior, and we need to be thinking not only about goods and services, but assets, and how payments are made.
The second typical manifestation of demand/supply analysis is what shows up in most principles and intermediate macro textbooks. That’s aggregate demand/aggregate supply (AD/AS). So, that addresses some of the problems with the micro approach to inflation, as there are assets in there (money and bonds, implicitly), and it’s sort of general equilibrium. The idea is to make use of a tool an undergraduate already knows something about - supply and demand - in constructing a macro model which we can reduce to an upward-sloping supply curve and a downward-sloping demand curve, in (y,P) space, where y is a quantity (aggregate output of goods and services), and P is the price of goods and services in units of money.
Unfortunately, AD/AS doesn’t get us to where we want to go either. First, it’s explaining the price level, not its rate of change. Second, in general equilibrium, we can’t separate demand from supply. For example, the households in this world are on the supply side of the labor market (which helps to determine aggregate supply), on the demand side of the market for goods and services, and on the demand side of the market for money. So exogenous factors affecting households will shift both the AD and AS curves. As well, as people explained at least 45 years ago, the forward looking behavior of economic agents, which is critical for thinking about monetary phenomena, implies that everything depends on everything else — you can’t identify aggregate demand and aggregate supply curves through exclusion restrictions. That’s what Chris Sims called “incredible identification.”
Typically, in undergrad macro, people will try to explain inflation through some combination of the demand side of AD/AS (that’s IS/LM) and a PC, with exogenous inflation expectations. That of course misses the supply side factors that people are claiming are important now, and also misses the dynamics - we want to explain where the inflation expectations come from. New Keynesian models involve an attempt to bring AD/AS into the modern age. NK is general equilibrium, with optimizing behavior explicitly modeled, and forward-looking economic agents with rational expectations. And, with the aid of some tricks, you can reduce that to an effectively demand-determined system (in a precise sense) with a PC. Though sometimes sold as some kind of microfoundation for IS/LM/PC, NK actually isn’t. I don’t think Keynes, Hicks — and whoever made up AD/AS — would recognize it.
One might be able to explain a rise in inflation in an NK model due to technological factors which affect the output gap, though I’m not sure. But if you can, I think you end up in the same place as with the raw PC reasoning I went through above. That is, the efficient level of output is lower, implying a lower level of output consistent with the same inflation rate, given inflation expectations. But then the high inflation goes away on its own, as the technological constraints relax.
A standard narrative seems to be that pandemic restrictions and lockdowns have disrupted supply chains, so that output is supply-constrained. And demand has been high. Central bankers (and I’ve heard these words come out of the mouths of both Jay Powell and Tiff Macklem, the Governor of the Bank of Canada) then call this a situation with “excess demand” which purportedly propels inflation.
So what if we forget about models, and look at the outcomes for real variables to see if we can extract anything from that. What I’m looking for is some evidence of constraints on production and, maybe, “excess demand.”
First, go back to Chart 3, which shows a persistently high level of job vacancies and a very low unemployment rate. Jay Powell mentioned this in his last press conference, and proposed the idea that it might be possible, through tight monetary policy, to bring down the vacancy rate with no effect on the unemployment rate (“bringing supply into line with demand,” or something like that). Well, good luck with that. Typically in a recession, vacancies and unemployment move in opposite directions, and we might expect that a monetary-policy-induced recession would produce that sort of movement along the Beveridge curve (a well-established regularity). Even worse, one feature of the financial crisis recession in 2008-09 was that the Beveridge curve shifted — we were observing more unemployment given the vacancy rate. So maybe a recession would produce not so much movement down in vacancies, and lots of movement up in unemployment.
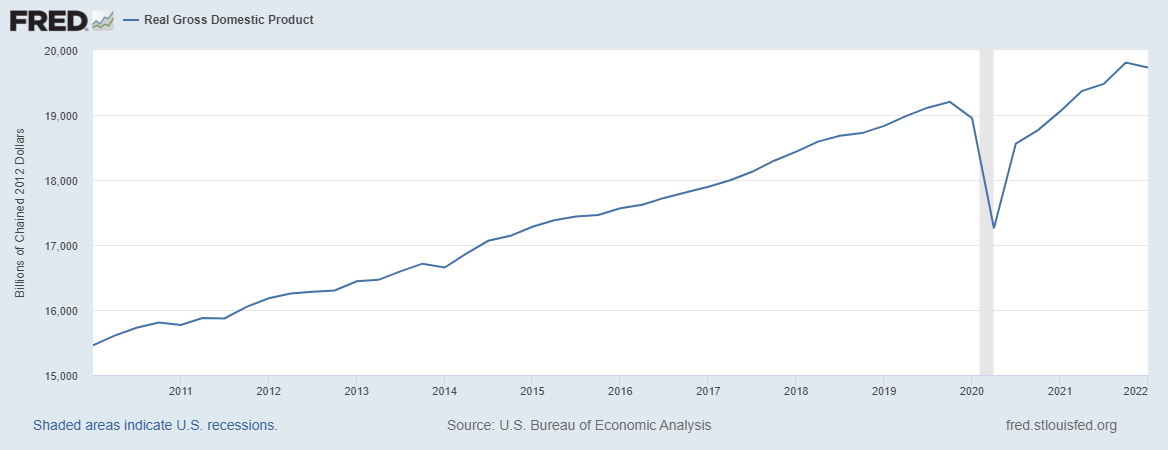
Next, here’s the path of real GDP:
Chart 5
So, except for the downward blip in 2022Q1, real GDP is pretty much back to its pre-pandemic trend. In terms of private domestic expenditures:
Chart 6
Chart 7
And finally, imports and exports:
Chart 8
So, I don’t see any indication in the above data that expenditure is being constrained by technology (which includes the state of supply chains). Domestic private spending is roughly on the pre-pandemic trend, and imports are booming. Exports, however, are well below the pre-pandemic trend. But if international trade is supposed to be so arduous, why are imports so high?
I know what you’re going to say. Supply chains! I can’t buy a car. I can’t buy cat food. But technology is always constraining output, which I hope doesn’t surprise you, and people can substitute, as they’re obviously done. If technological constraints were a big deal at the aggregate level, you would see it in the aggregate quantities.
The excess demand people of course might argue that what we’re seeing is “overheating,” which means output in excess of efficient output. How could we get that? In theory, either someone is getting fooled — workers think their real wage is high when it’s not, firms think their relative price is high when it’s not — or some wage or price is sticky. With sticky wages, firms and workers somehow can’t bear to negotiate a higher wage, but workers for some reason want to keep working even given the lower real wage. With sticky prices, some firms can’t bear to increase their prices, even though there is a load of customers coming in the door, and they proceed to hire the workers to serve that load of customers. The interesting part of this “overheating” phenomenon is that I don’t see anyone checking to see if there is widespread fooling going on, or whether there are firms and workers complaining because the costs of increasing prices and wages are so damn high. The workers may be complaining that the firms aren’t paying enough, but that’s a different story. I certainly haven’t noticed the price of anything being stuck recently.


