Part II: High Inflation: Where Did It Come From?
[Continued from Part I.]
Sometimes people think of an increase in oil prices as a negative supply shock. What about that?
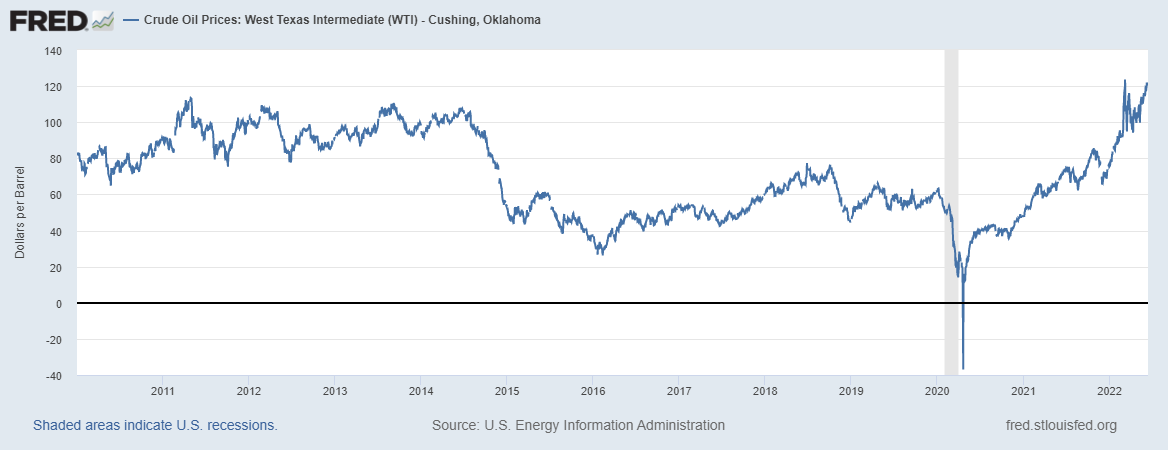
Chart 9
So, in dollar terms, oil prices aren’t that much higher than in the 2010-2014 period (and I checked this today, and this price is down to $105). Further, if you adjust for inflation, you get this:
Chart 10
So, in relative terms (deflated by the CPI), oil prices are higher than before the pandemic, but lower than in the 2010-2014 period. So, relative to April 2020, we’re paying four times as much in goods and services for oil, but in April 2020 oil was really cheap. If you can remember as far back as 2014, oil is relatively cheap now.
It’s Fiscal Policy?
This seems to be a more specific supply/demand story. Larry Summers and Olivier Blanchard are often credited with prescience for warning in advance that overly generous federal government transfers could lead to high inflation. And Summers and Blanchard have a common AD/AS/IS/LM/PC view of the world.
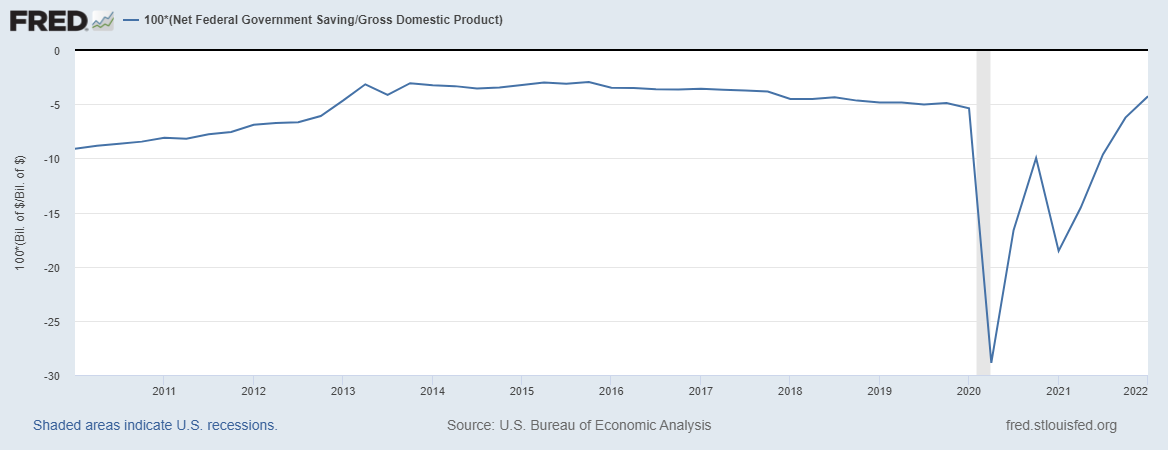
A key feature of the pandemic was of course generous federal income support — transfers financed by debt issue. That shows up as a high deficit, made larger by the falloff in tax revenue due to the decline in economic activity early in the pandemic period.
Chart 11
And, the temporarily high deficit has left the U.S. with a higher level of debt, relative to GDP.
Chart 12
So, first, the deficit, as a fraction of GDP is actually a little smaller than just before the pandemic, and the debt/gdp ratio is somewhat higher, but maybe not so much higher, and it’s no longer growing. Thus, any effect of fiscal policy should be temporary, barring for example the effects on debt service of higher interest rates. Second, there is no clear regularity in the relationship between government debt and inflation. Indeed, Japan famously ran government debt up in excess of 200% of GDP, with no apparent inflationary effects. And the runup in debt from 60% to 100% of GDP in the US, from 2008 to 2015, had no discernible effect on inflation.
Inflation is Always and Everywhere a Monetary Phenomenon?
That’s of course a quote from Milton Friedman who, along with his fellow quantity theorists, thought that the quantity of money — defined as the quantity of assets in existence that are being used for transactions purposes — determines the price level. And growth in the money supply, according to Friedman, is what explains inflation. So, if you want to bring inflation down, you reduce growth in the money supply. A quaint idea now but, since people seem to now be having fond memories of Paul Volcker — and since Jay Powell now seems to want to be the modern-day Paul Volcker — I should point out that Volcker was actually consciously implementing a monetarist deflationary plan. He didn’t actually “jack up interest rates,” as the standard narrative goes. The FOMC at the time decided that they were not interested in targeting an overnight interest rate, but in reducing the rate of money growth and letting market interest rates do whatever. Volcker actually finished his 8 years as FOMC chair with lower inflation and lower nominal interest rates than when he started.
We could argue that monetarism worked in bringing down inflation during the Volcker era, but it proved a failure in ongoing inflation control — that’s why most central banks opted for inflation targeting backed up by day-to-day overnight interest rate targeting. Basically, monetarism works only if there is a systematic and predictable relationship between aggregate economic variables and money — a stable money demand function. But money demand functions are as notoriously unstable as the Phillips curve.
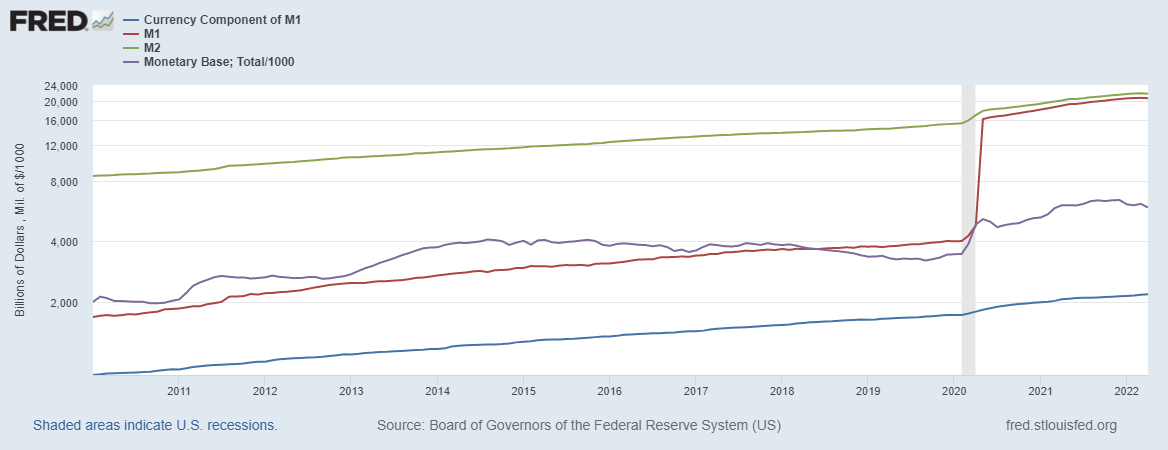
However we should look at what is going on with standard monetary quantities during the pandemic, as that might tell us something useful, and because some people (including John Cochrane) have tied monetary phenomena to fiscal policy in trying to explain what’s going on with inflation. So, first we’ll look at some standard monetary aggregates: currency, the monetary base, M1, and M2 (on a log scale):
Chart 13
What stands out in that figure is the huge increase in M1. That’s an increase of about $11 trillion, and most of it happens from April 27 to May 4, 2020. But, not to worry, that’s just the effect of a regulatory change that effectively eliminated the difference between a savings account and a checking account. So, best to ignore M1. We know more or less what’s driving the monetary base - that’s the Fed’s quantitative easing (QE) program. Focusing on 12-month growth rates in currency and M2:
Chart 14
So growth in currency outstanding and in M2 was unusually high during the pandemic, with growth rates peaking in early 2021. Those growth rates are now close to where they were pre-pandemic, though in level terms consumers are holding more liquid assets. M2 rose from about 70% of GDP before the pandemic to about 90% now. If you’re thinking that’s some money multiplier story associated with QE, it certainly doesn’t look like it. The increase in M2 had to be matched by an increase in assets on banks’ balance sheets, and the assets acquired by the banks were mainly Treasuries, reserves, and privately-issued securities, not loans. That is, the government increased its dissaving, issuing a lot more debt during the pandemic. Ignoring the foreign sector, the private sector had to dissave and acquire the debt. Basically, they did a good portion of that through the banking sector, holding the assets in the form of insured deposits backed by government debt, some of which the Fed had turned into reserves by way of QE.
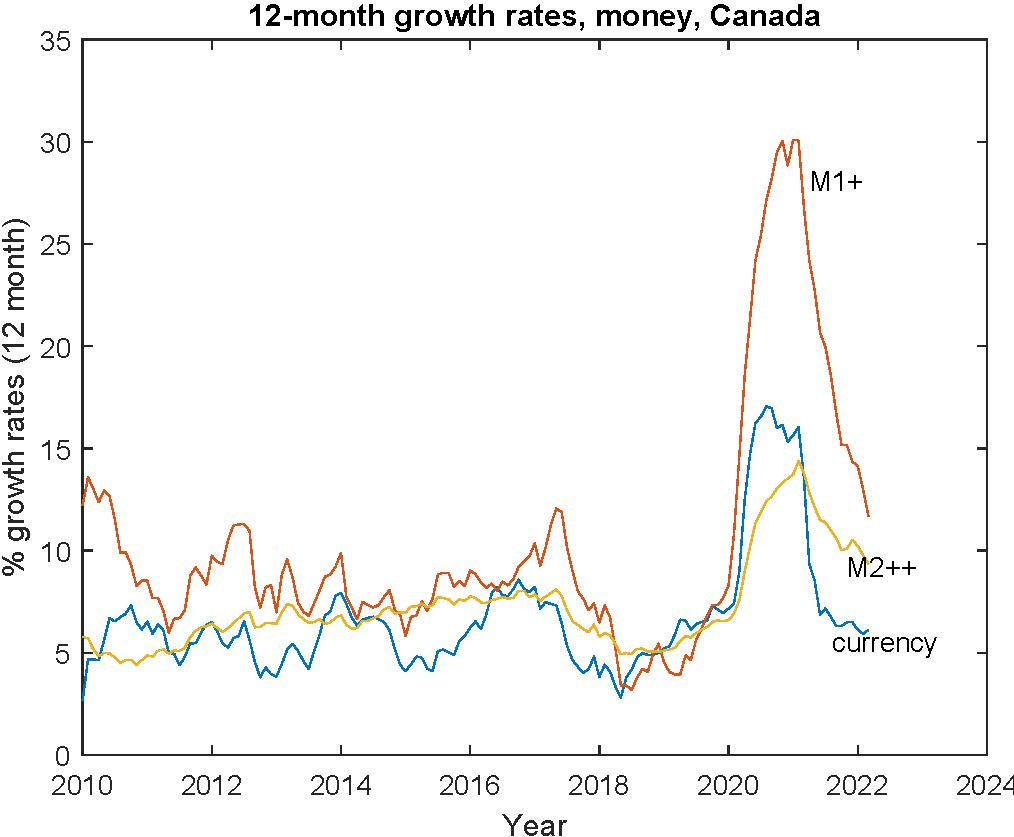
As a check, we saw an almost identical phenomenon in Canada.
Chart 15
The measures of money are different (it’s a different banking system), but you can see a similar pattern, with growth rates peaking around the same time as in the U.S., and growth rates currently approaching pre-pandemic rates.
So, what’s going on? We’re not in a Milton Friedman world in which the central bank can control the quantity of means of payment by controlling outside money, with a fixed relationship between the two. Though there’s a story out there, which John Cochrane was discussing, that the federal government and the Fed coordinated a “helicopter drop” during the pandemic. That is, according to the story, the government issued debt to finance transfers, and the Fed bought the debt with money — thus, effectively money was issued to the private sector, and it’s obvious this causes inflation (according to the story), just like in Milton Friedman’s parable. To me, this doesn’t make sense. For example, note in Chart 10, as I mentioned earlier, that federal government debt goes from about 60% of GDP before the financial crisis, to about 100% of GDP in 2015. And over that time the Fed converted a load of that into reserves. So where was the inflation then?
What seems to be going on is that transactions accounts at banks are demand determined, in that the assets acquired by banks to back the increase in deposits could as easily be held outside the banking sector, by mutual funds for example. Even reserves can migrate outside the banking sector in the form of reverse repurchase agreements — indeed, with assets of about $9 trillion, the Fed currently has about $2 trillion in reverse repos outstanding.
Of course, people accumulated balances as bank deposits and currency during the pandemic for a reason, or reasons. And we can certainly construct a story that in some ways fits the standard narrative about the current sources of high inflation. That is, at the beginning of the pandemic, people accumulated assets in forms they could readily spend, because they were postponing consumption, and were uncertain about when restrictions would relax so they could resume normal activity. But once things did open up, all that deferred spending was unleashed. As well, people needed transactions balances to buy the houses and consumer durables that were rapidly changing hands during the pandemic (new and used). But if the accumulation of money balances is at worst an underlying symptom of the inflationary phenomenon associated with the pandemic, it looks like the inflation cannot sustain itself. That is, M2 relative to GDP has leveled off, and should start to fall.
Chart 16
But, the high level of bank deposits and currency could, at least in part, be due to a flight to safety. The world is now a more scary place, and insured deposits and US currency may be seen as a good place to park your wealth. Indeed, in Chart 14, you can see that M2/GDP rose during the financial crisis, then stayed high, in fact increasing from about 60% to 70% from 2010 to the beginning of 2020. So, who knows, M2/GDP may not decrease further, because bank deposits and currency are being held as safe assets, not for transactions purposes.
Conclusion
The bottom line is that, if we sift through all the inflation narratives out there, some of them make no sense, and some of them make a little sense. Phillips curve narratives won’t help us understand inflation — these narratives are at best descriptive, and won’t help us formulate good monetary policy. In the supply/demand narratives, the idea that “supply” is constraining activity isn’t any more true than it normally is, in spite of the fact that some goods are hard to find. Though gasoline prices loom large in popular discussion, oil is actually relatively cheap now compared to 2014.
What makes most sense to me here is a monetary story about high inflation, related to the pandemic — and of course it has to be a pandemic story, otherwise we would still be in the low-inflation pre-pandemic world we used to complain about. But the monetary story isn’t a Milton Friedman story, according to which the Fed’s actions caused inflation, through QE for example — it’s a story where the accumulation of liquid assets is a symptom. People deferred consumption, they accumulated transactions balances, and then reduced the growth in transactions balances over time. And the economy is beginning to look more like its pre-pandemic self in many ways. The fed funds rate is even where it was at the beginning of the pandemic, at least for the time being. What still sticks out is of course high inflation, and the high job vacancy rate, which may be due to low immigration. I know it’s become commonplace to panic about high inflation now, but I’d say it looks transitory. Next, on to policy issues.


